Work Visa Trends (1987-2024):
- Total work visas issued: 10.4 million over 38 years
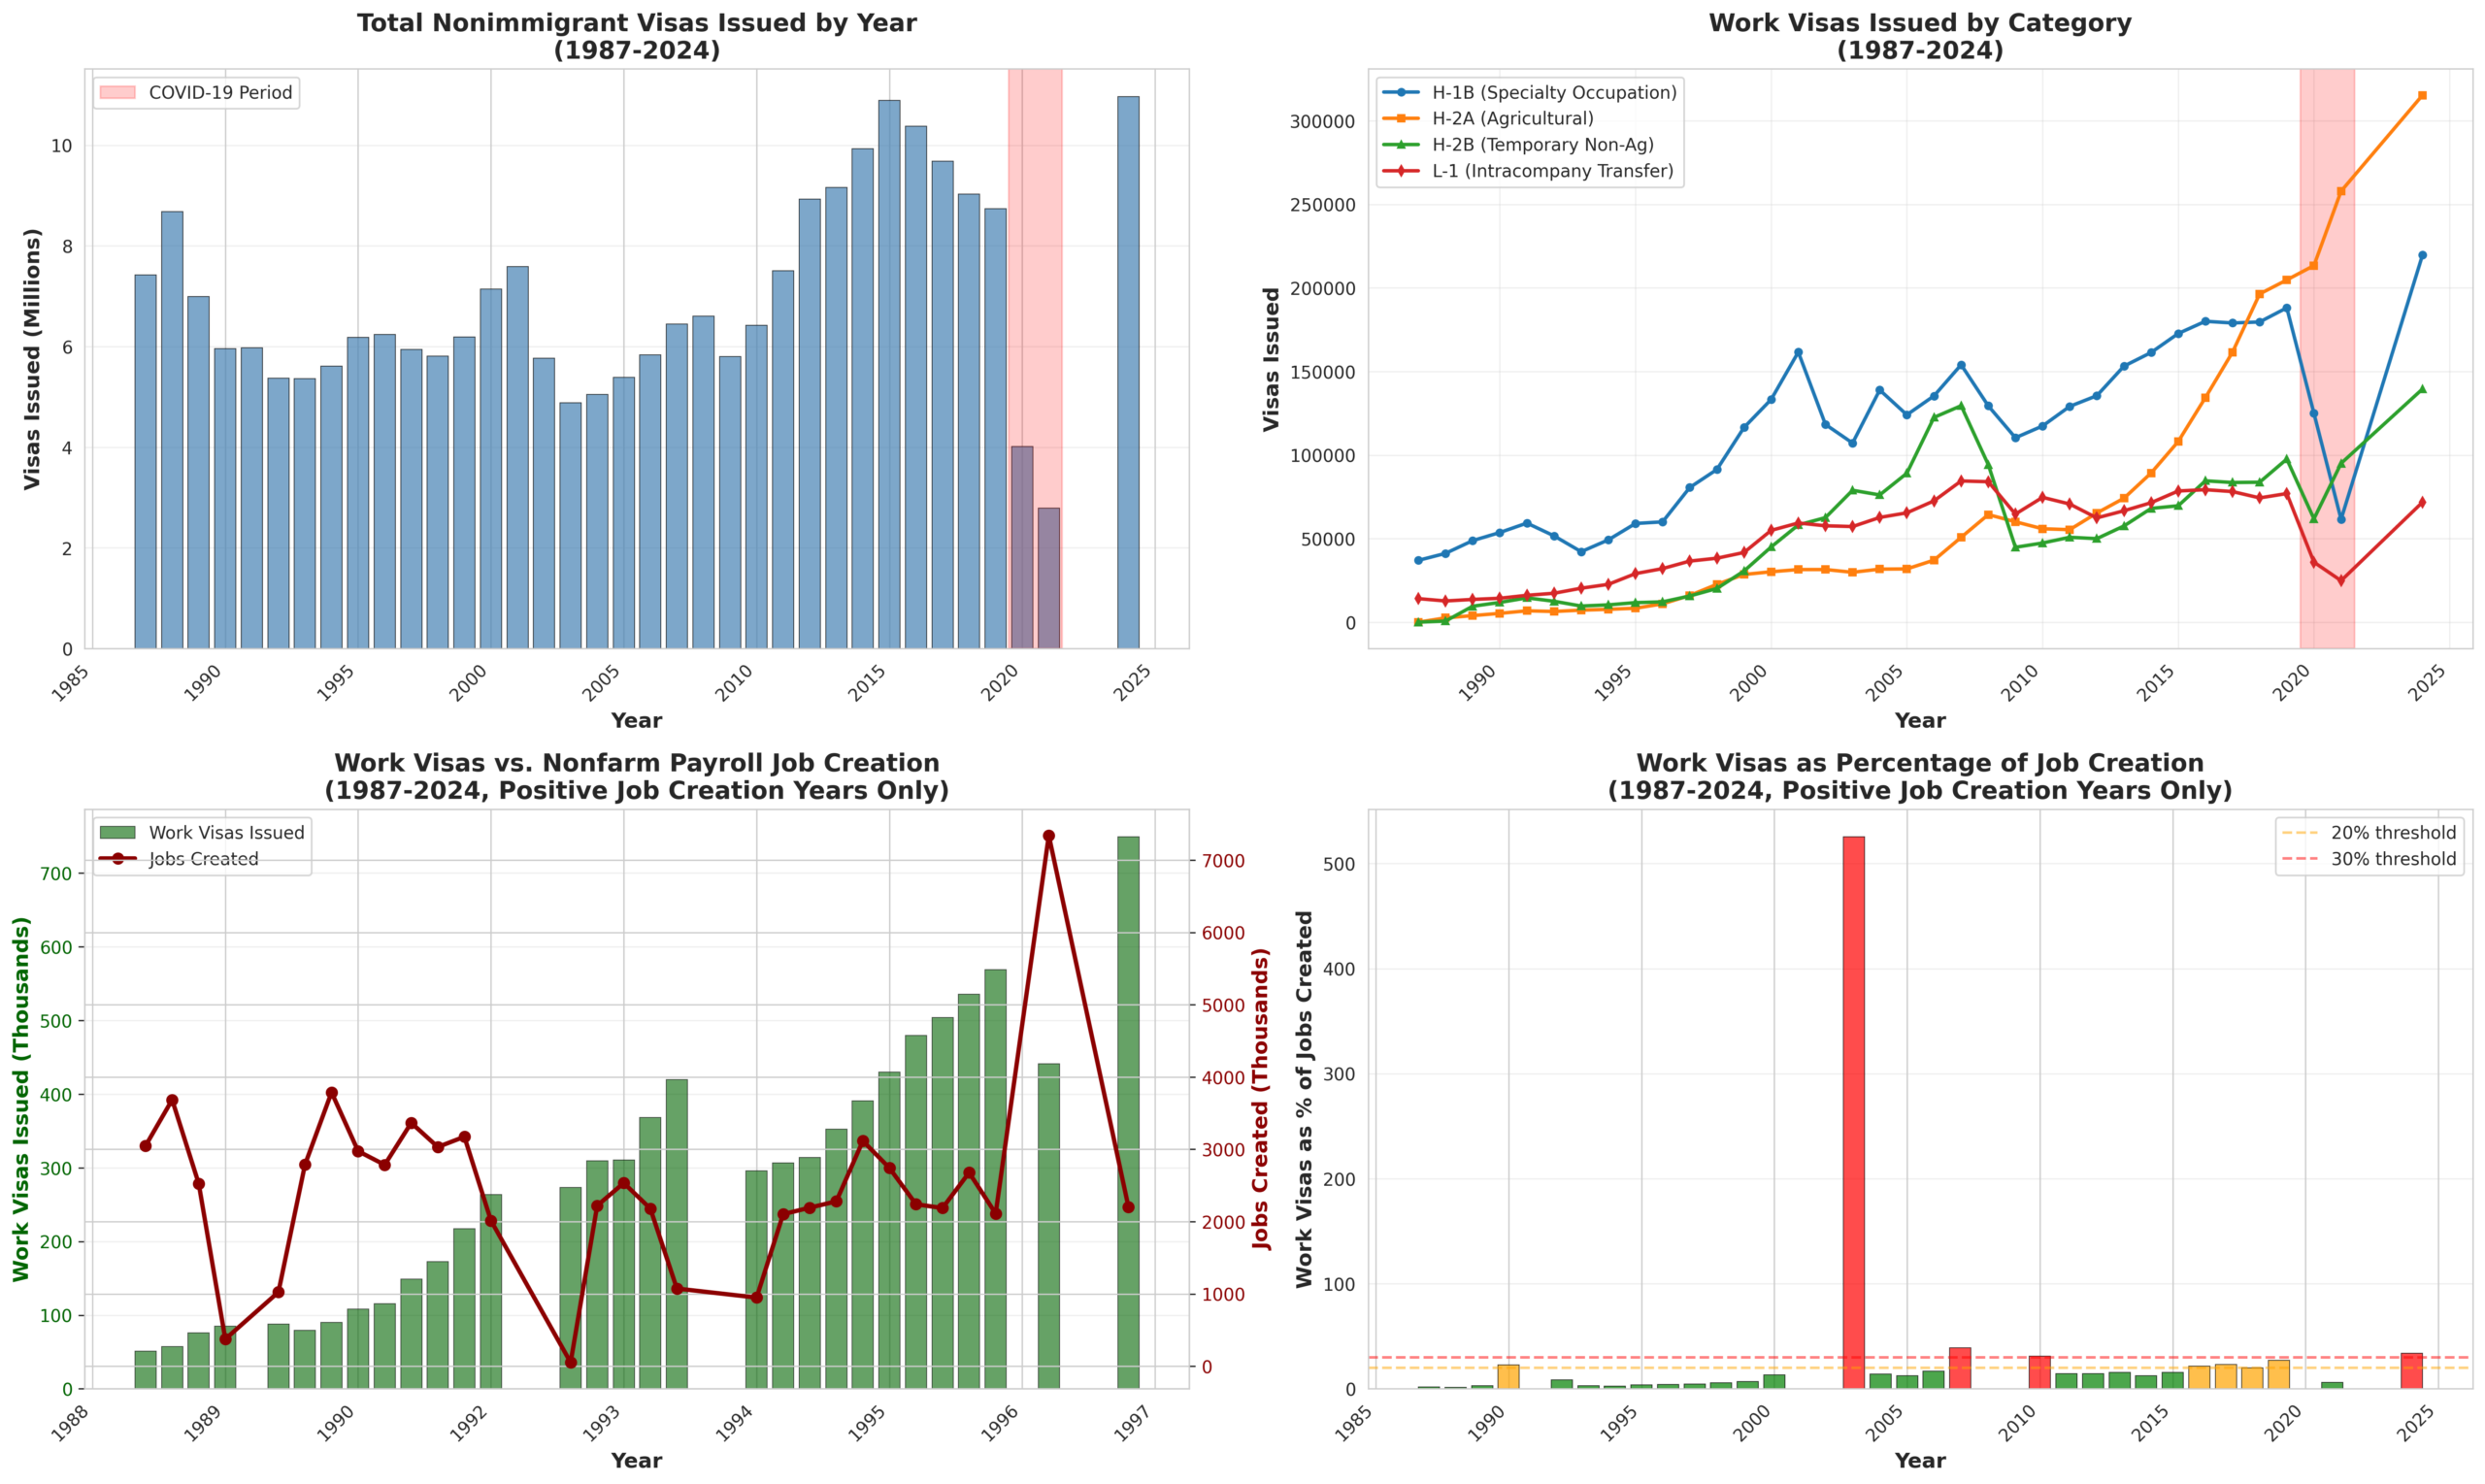
- 2024 represents a record high: 749,397 work visas (H-1B, H-2A, H-2B, L-1 combined)
- 48.8% increase from pre-COVID average (2015-2019)
2024 Breakdown:
- H-2A (Agricultural): 315,328 (42% of work visas) – the largest category
- H-1B (Specialty): 219,659 (29%)
- H-2B (Temp Non-Ag): 139,541 (19%)
- L-1 (Intracompany): 71,799 (10%)
Work Visas as % of Job Creation:
- 2024: 34% – work visas represent over one-third of all jobs created
- 2019: 27% (pre-COVID peak)
- 2010s average: ~15-20%
- 1990s average: ~5-10%
Notable Patterns:
- H-2A visas have surged – from ~6,000 in 1991 to 315,000 in 2024
- H-1B has plateaued around 180-220k since 2007 (due to statutory caps)
- The ratio of work visas to job creation has grown dramatically – from single digits in the 1990s to over 30% in 2024
The analysis reveals that work visa issuances, particularly in agricultural and temporary worker categories, have grown substantially relative to overall job creation. This is especially pronounced in 2024.