State Never Published FY2025 Visa Data, So We Rebuilt It

The State Department still hasn’t published its FY2025 nonimmigrant visa class-of-admission table, nearly eleven months after the fiscal year closed. Its monthly issuance reports kept publishing on schedule though, so we pulled and parsed all twelve ourselves and reconstructed the FY2025 numbers — H-1B, H-2A, H-2B and 74 other classes — now loaded into our visa data browser alongside every year back to 1987.

https://guestworkervisas.com/state_dept_fy2025_niv_reconstruction.php
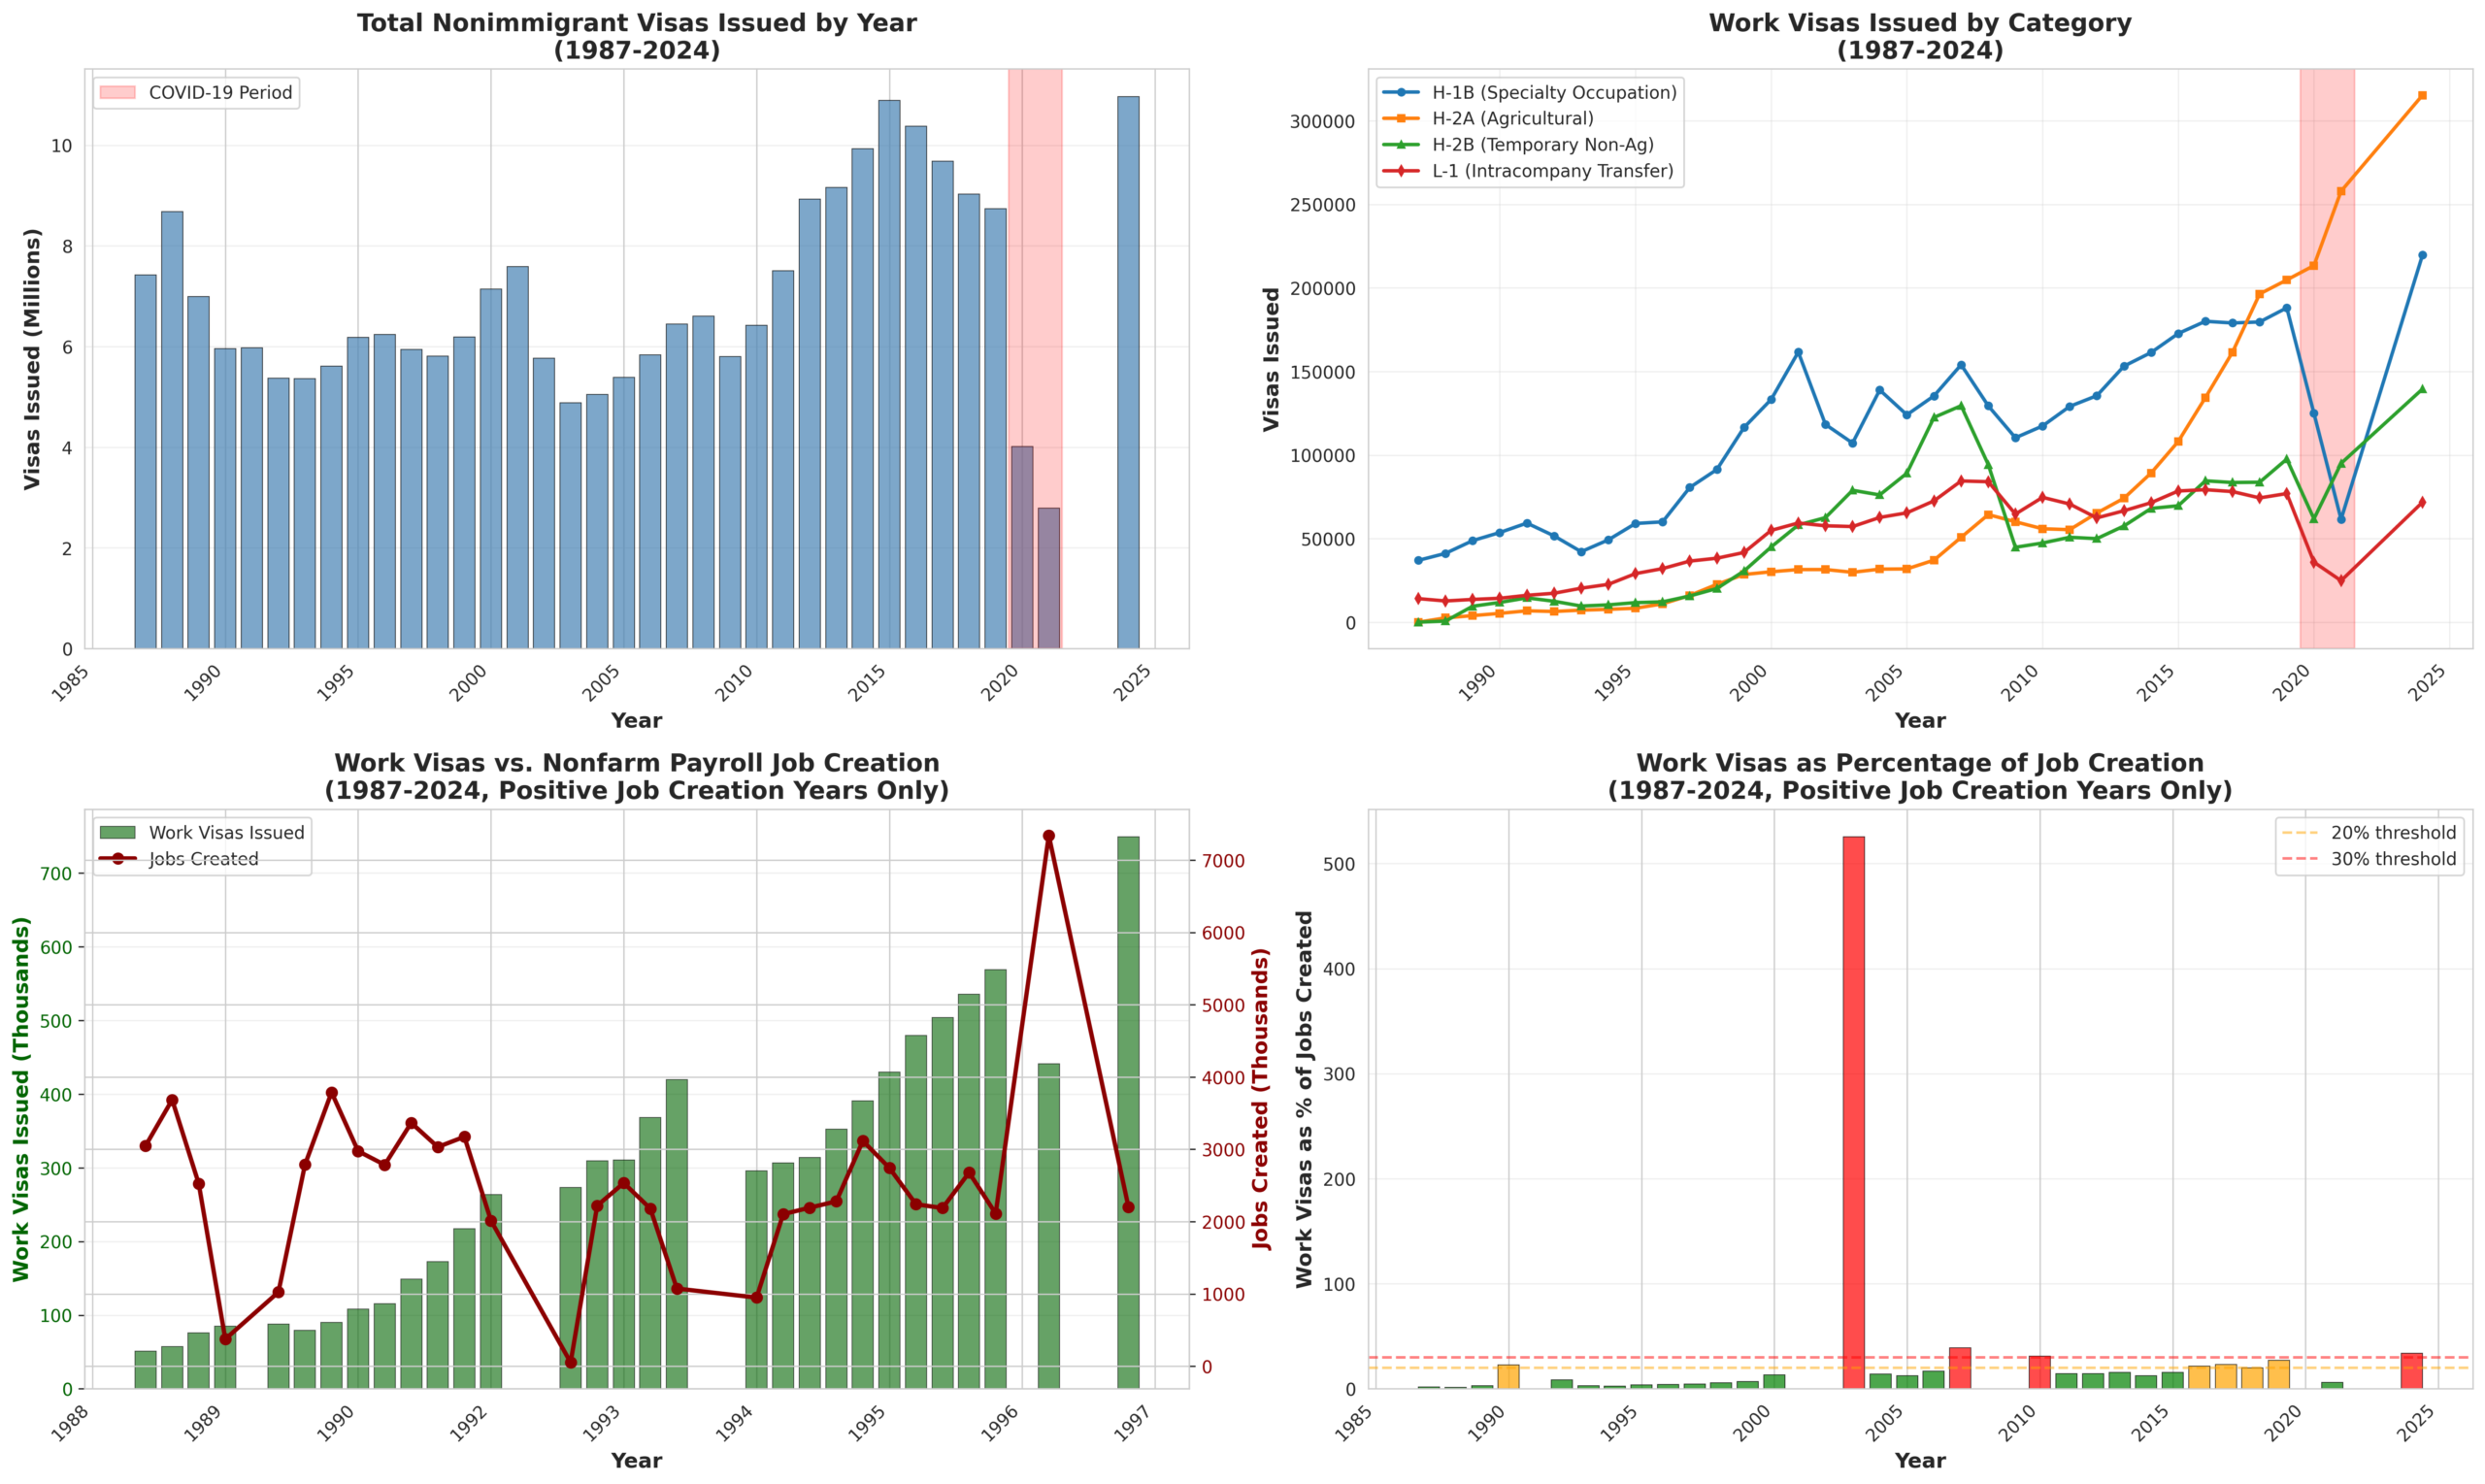
Nonimmigrant guest worker visa totals

Work Visa Trends (1987-2024):

  • Total work visas issued: 10.4 million over 38 years
  • 2024 represents a record high: 749,397 work visas (H-1B, H-2A, H-2B, L-1 combined)
  • 48.8% increase from pre-COVID average (2015-2019)

2024 Breakdown:

  • H-2A (Agricultural): 315,328 (42% of work visas) – the largest category
  • H-1B (Specialty): 219,659 (29%)
  • H-2B (Temp Non-Ag): 139,541 (19%)
  • L-1 (Intracompany): 71,799 (10%)

Work Visas as % of Job Creation:

  • 2024: 34% – work visas represent over one-third of all jobs created
  • 2019: 27% (pre-COVID peak)
  • 2010s average: ~15-20%
  • 1990s average: ~5-10%

Notable Patterns:

  1. H-2A visas have surged – from ~6,000 in 1991 to 315,000 in 2024
  2. H-1B has plateaued around 180-220k since 2007 (due to statutory caps)
  3. The ratio of work visas to job creation has grown dramatically – from single digits in the 1990s to over 30% in 2024

The analysis reveals that work visa issuances, particularly in agricultural and temporary worker categories, have grown substantially relative to overall job creation. This is especially pronounced in 2024.


visa_analysis_detailed