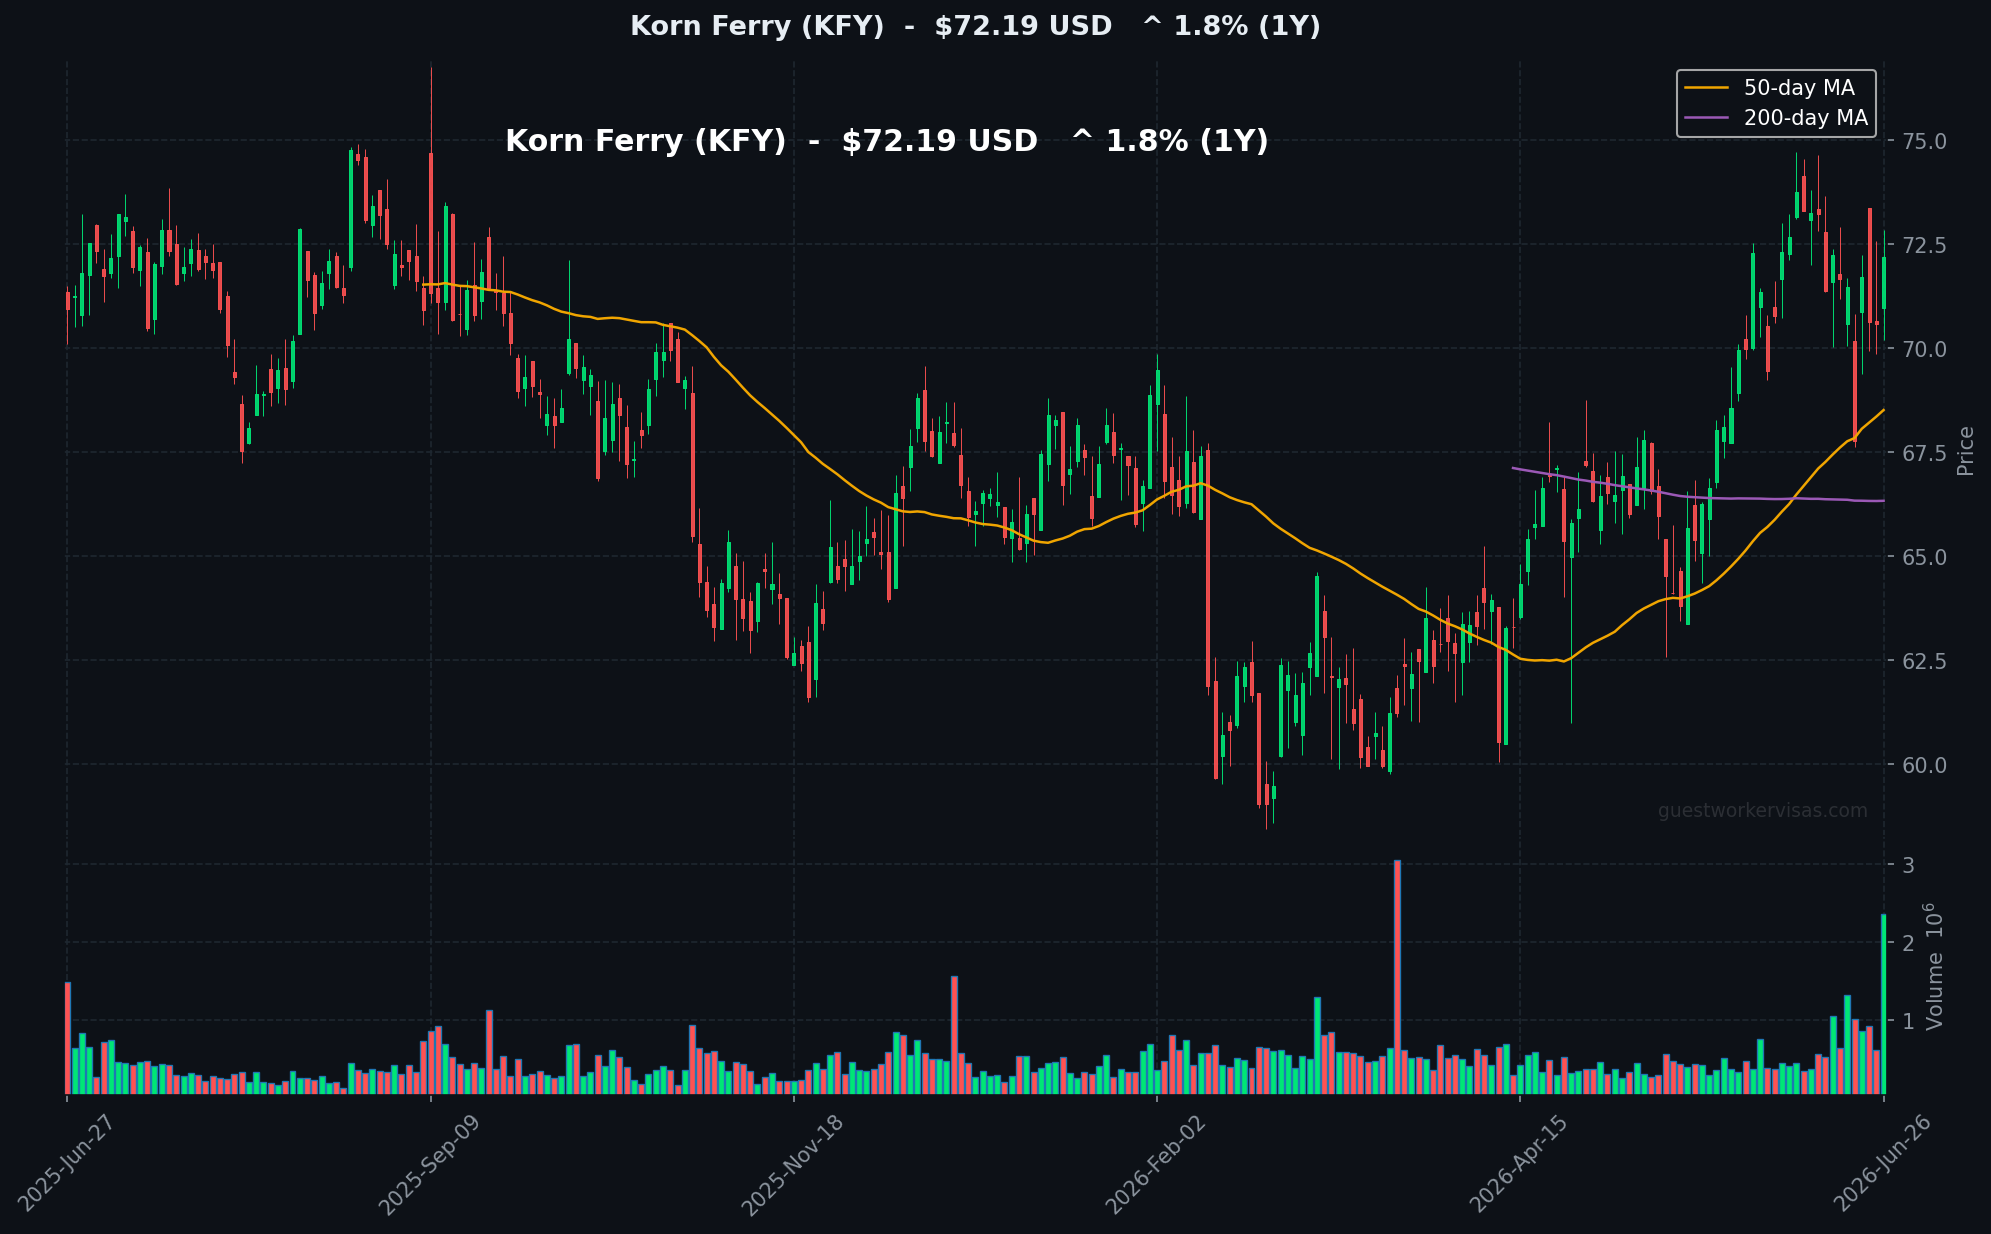
Read the full KORN FERRY (KFY) FY2026 Annual Report -> H-1B filings, executive compensation, geographic revenue, workforce data, and shareholder analysis
Read the full KEQU FY2026 Annual Report
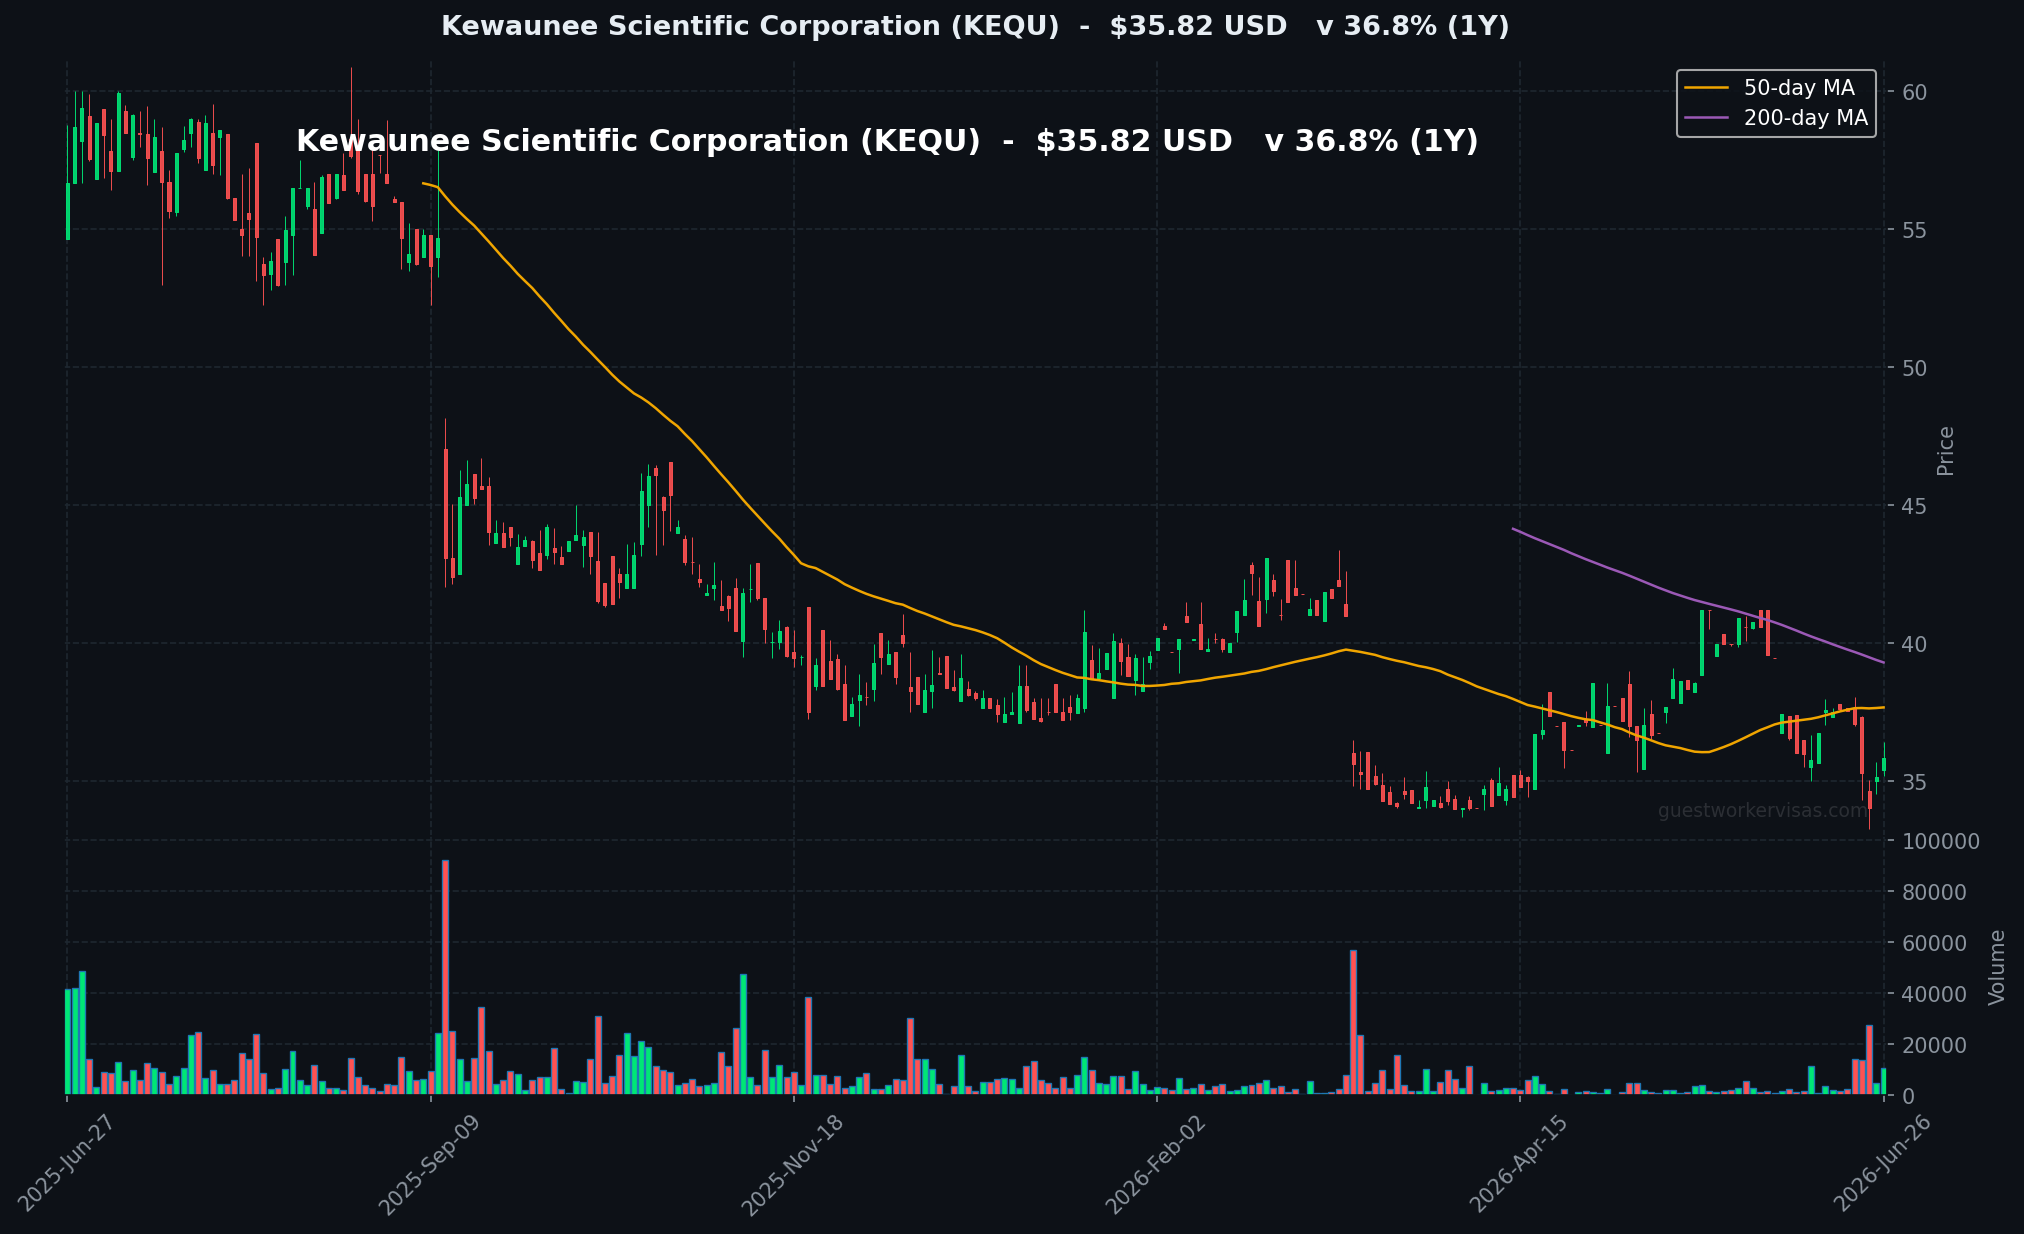
Read the full KEWAUNEE SCIENTIFIC CORP /DE/ (KEQU) FY2026 Annual Report -> H-1B filings, executive compensation, geographic revenue, workforce data, and shareholder analysis
Read the full YSGL FY2026 Annual Report
Read the full Yellowstone Group Ltd. (YSGL) FY2026 Annual Report -> H-1B filings, executive compensation, geographic revenue, workforce data, and shareholder analysis
Read the full ATEX FY2026 Annual Report
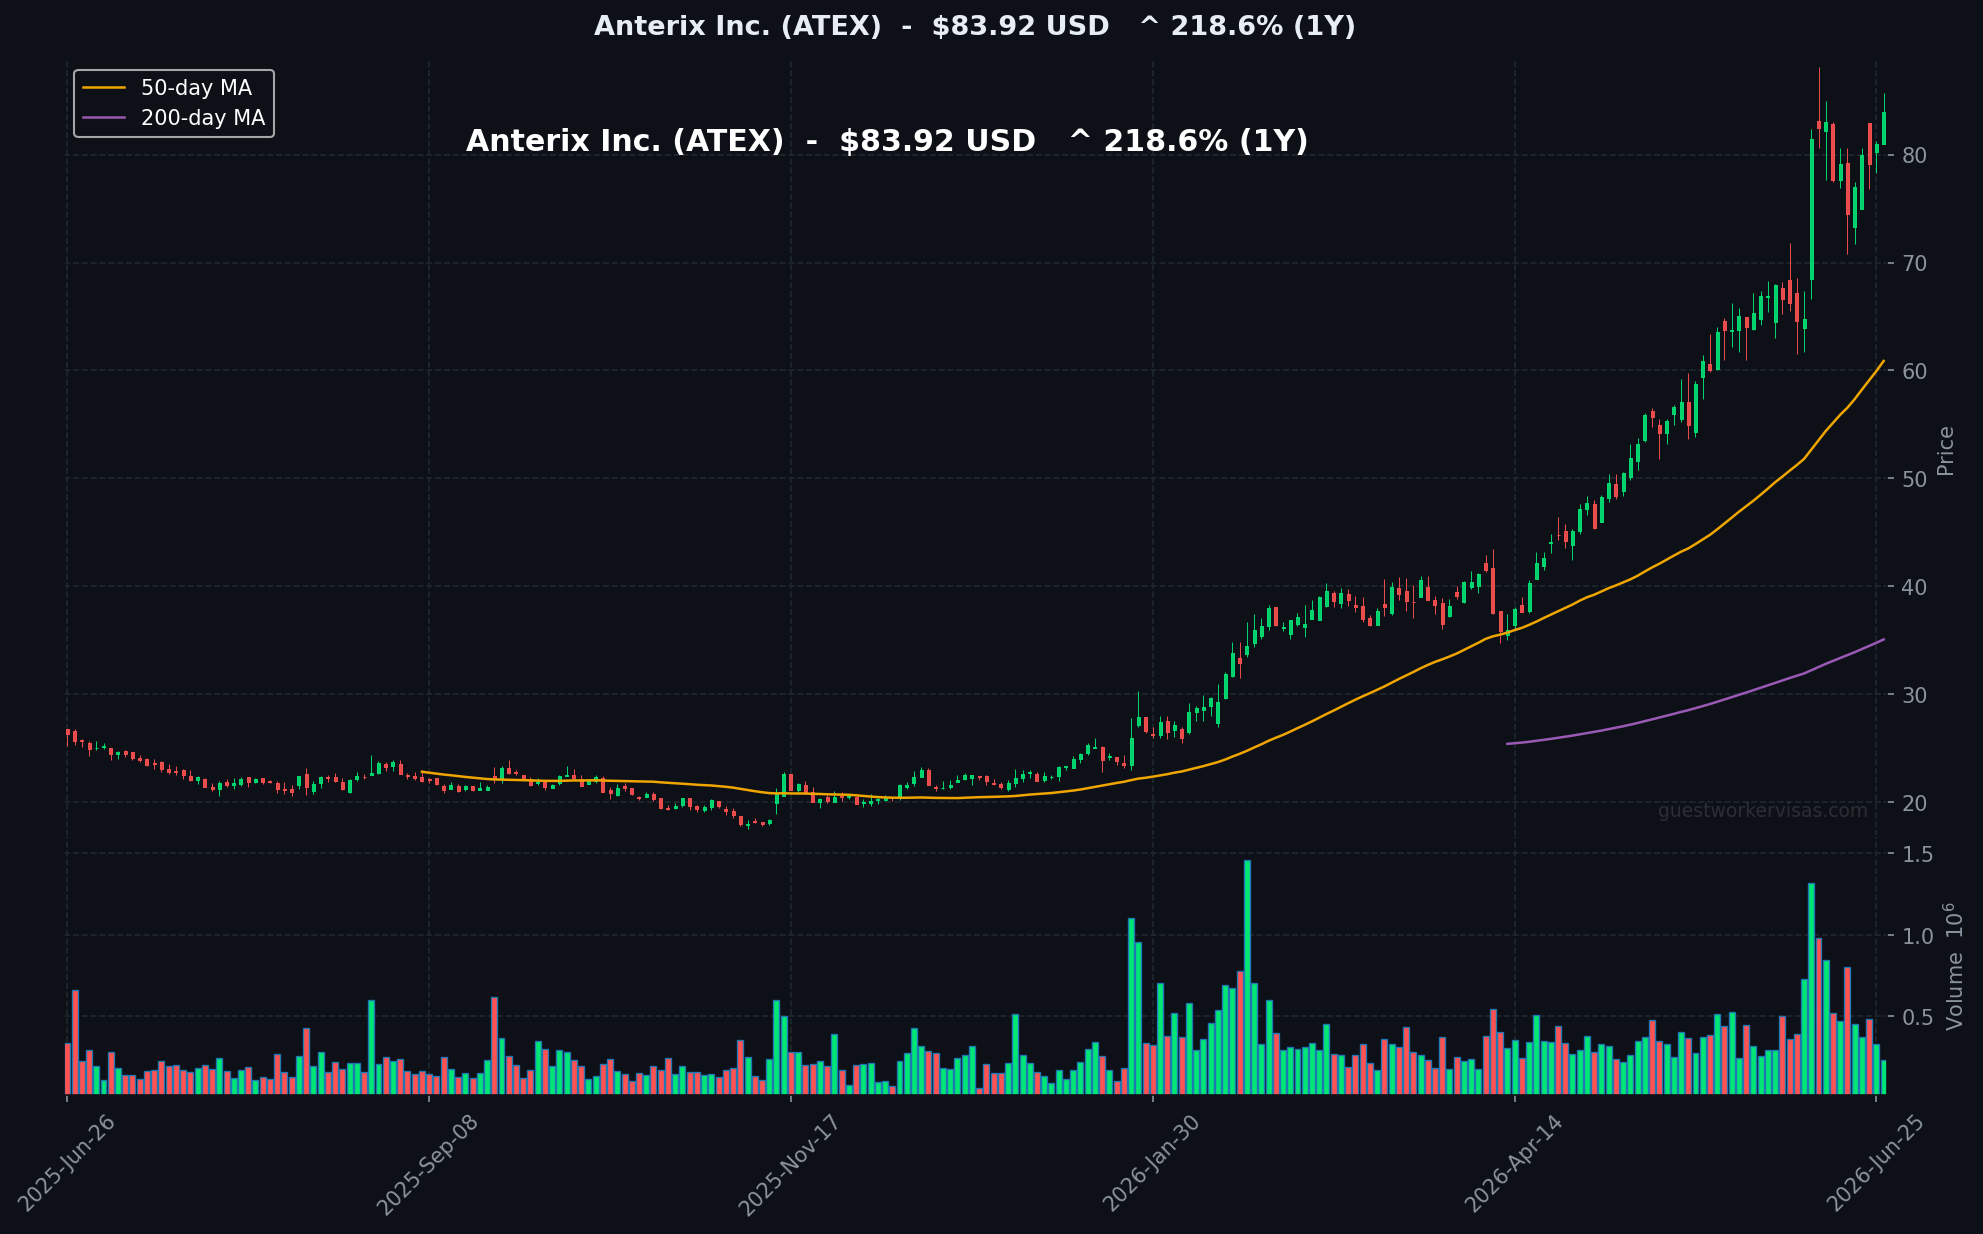
Read the full Anterix Inc. (ATEX) FY2026 Annual Report -> H-1B filings, executive compensation, geographic revenue, workforce data, and shareholder analysis
Read the full TPCS FY2026 Annual Report
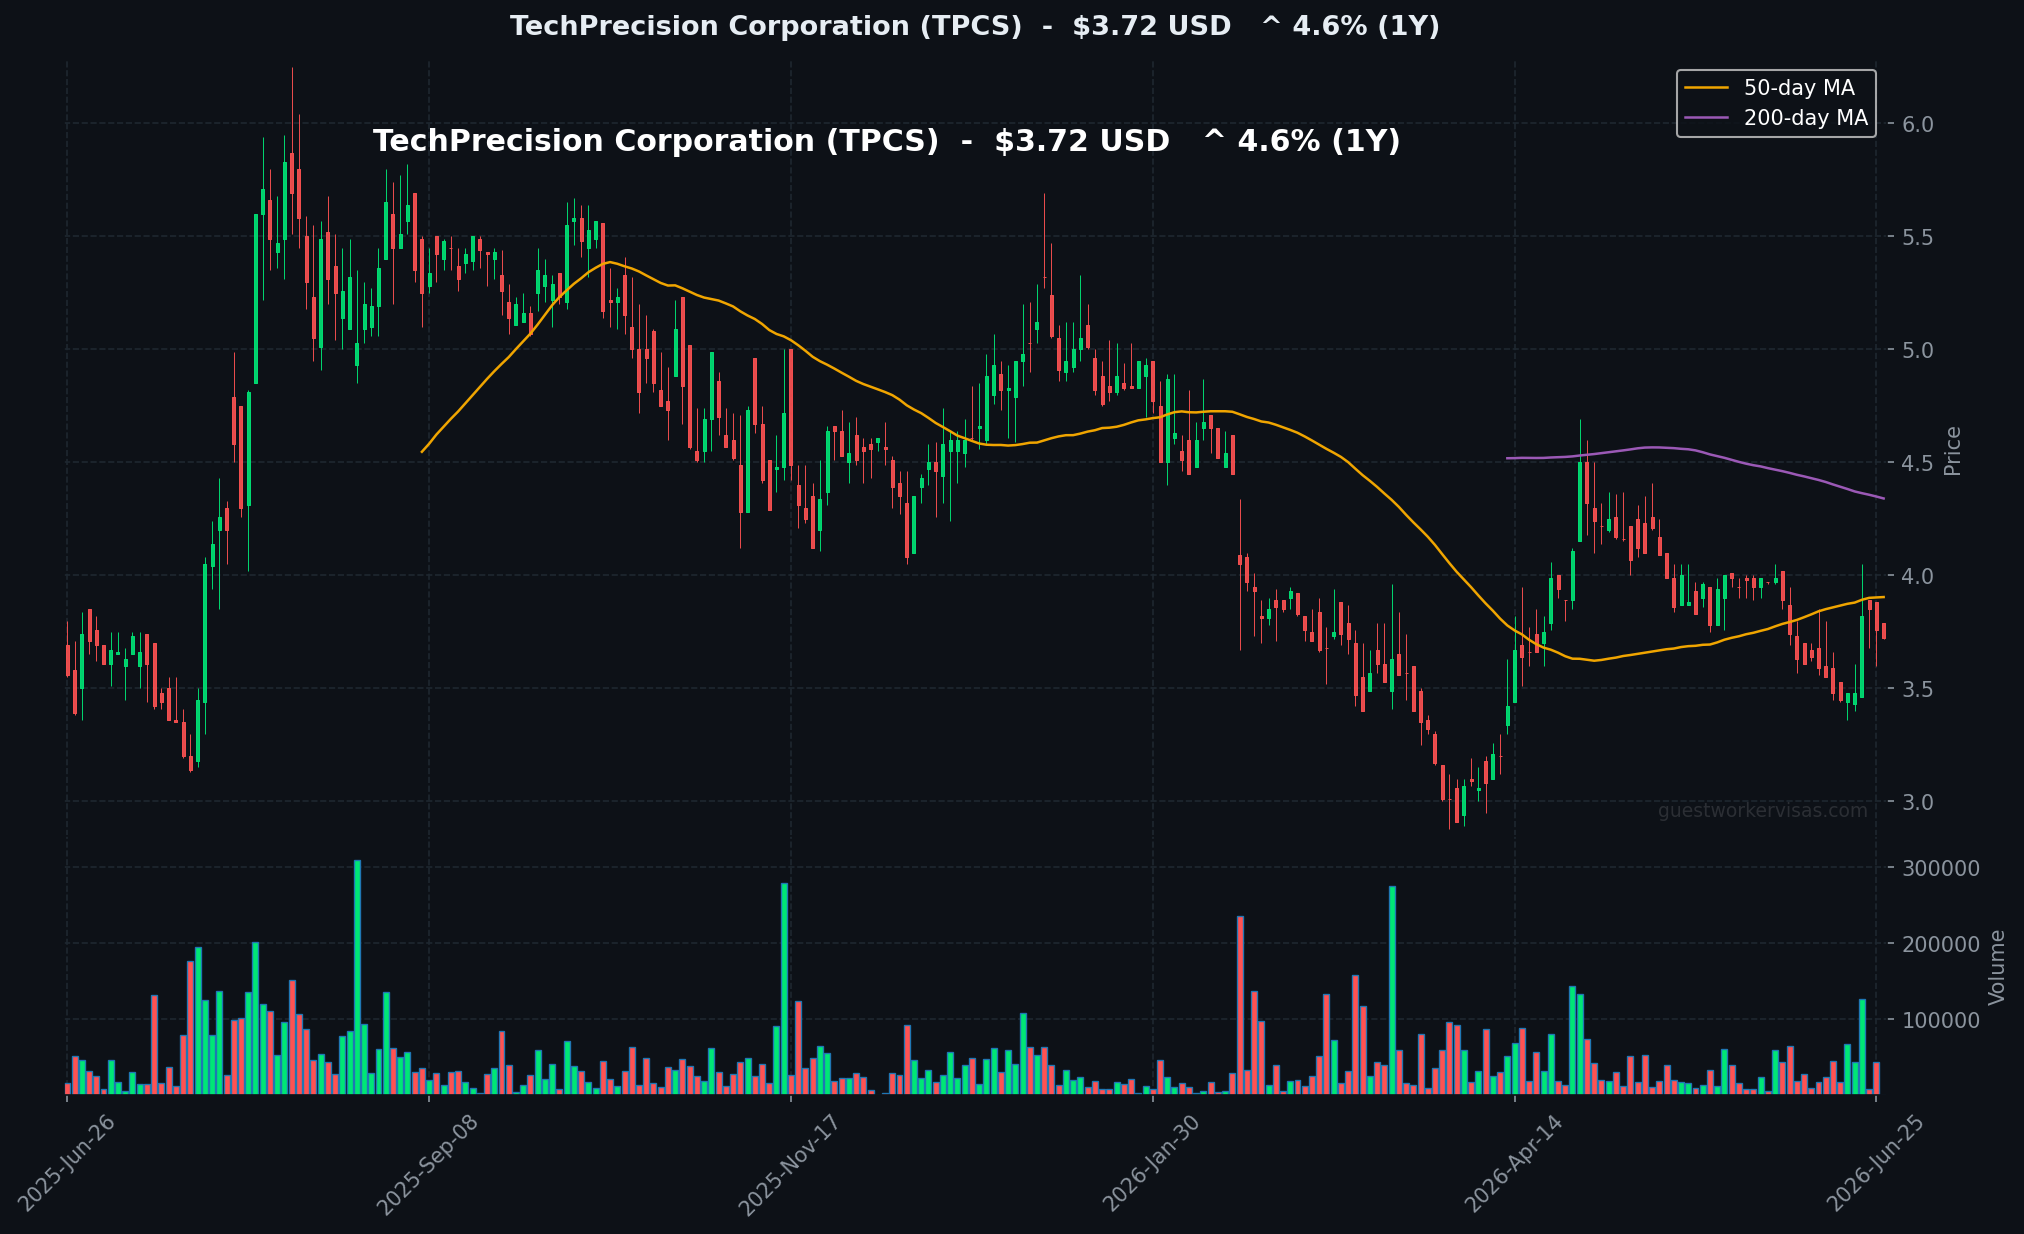
Read the full TECHPRECISION CORP (TPCS) FY2026 Annual Report -> H-1B filings, executive compensation, geographic revenue, workforce data, and shareholder analysis
Read the full AOUT FY2026 Annual Report
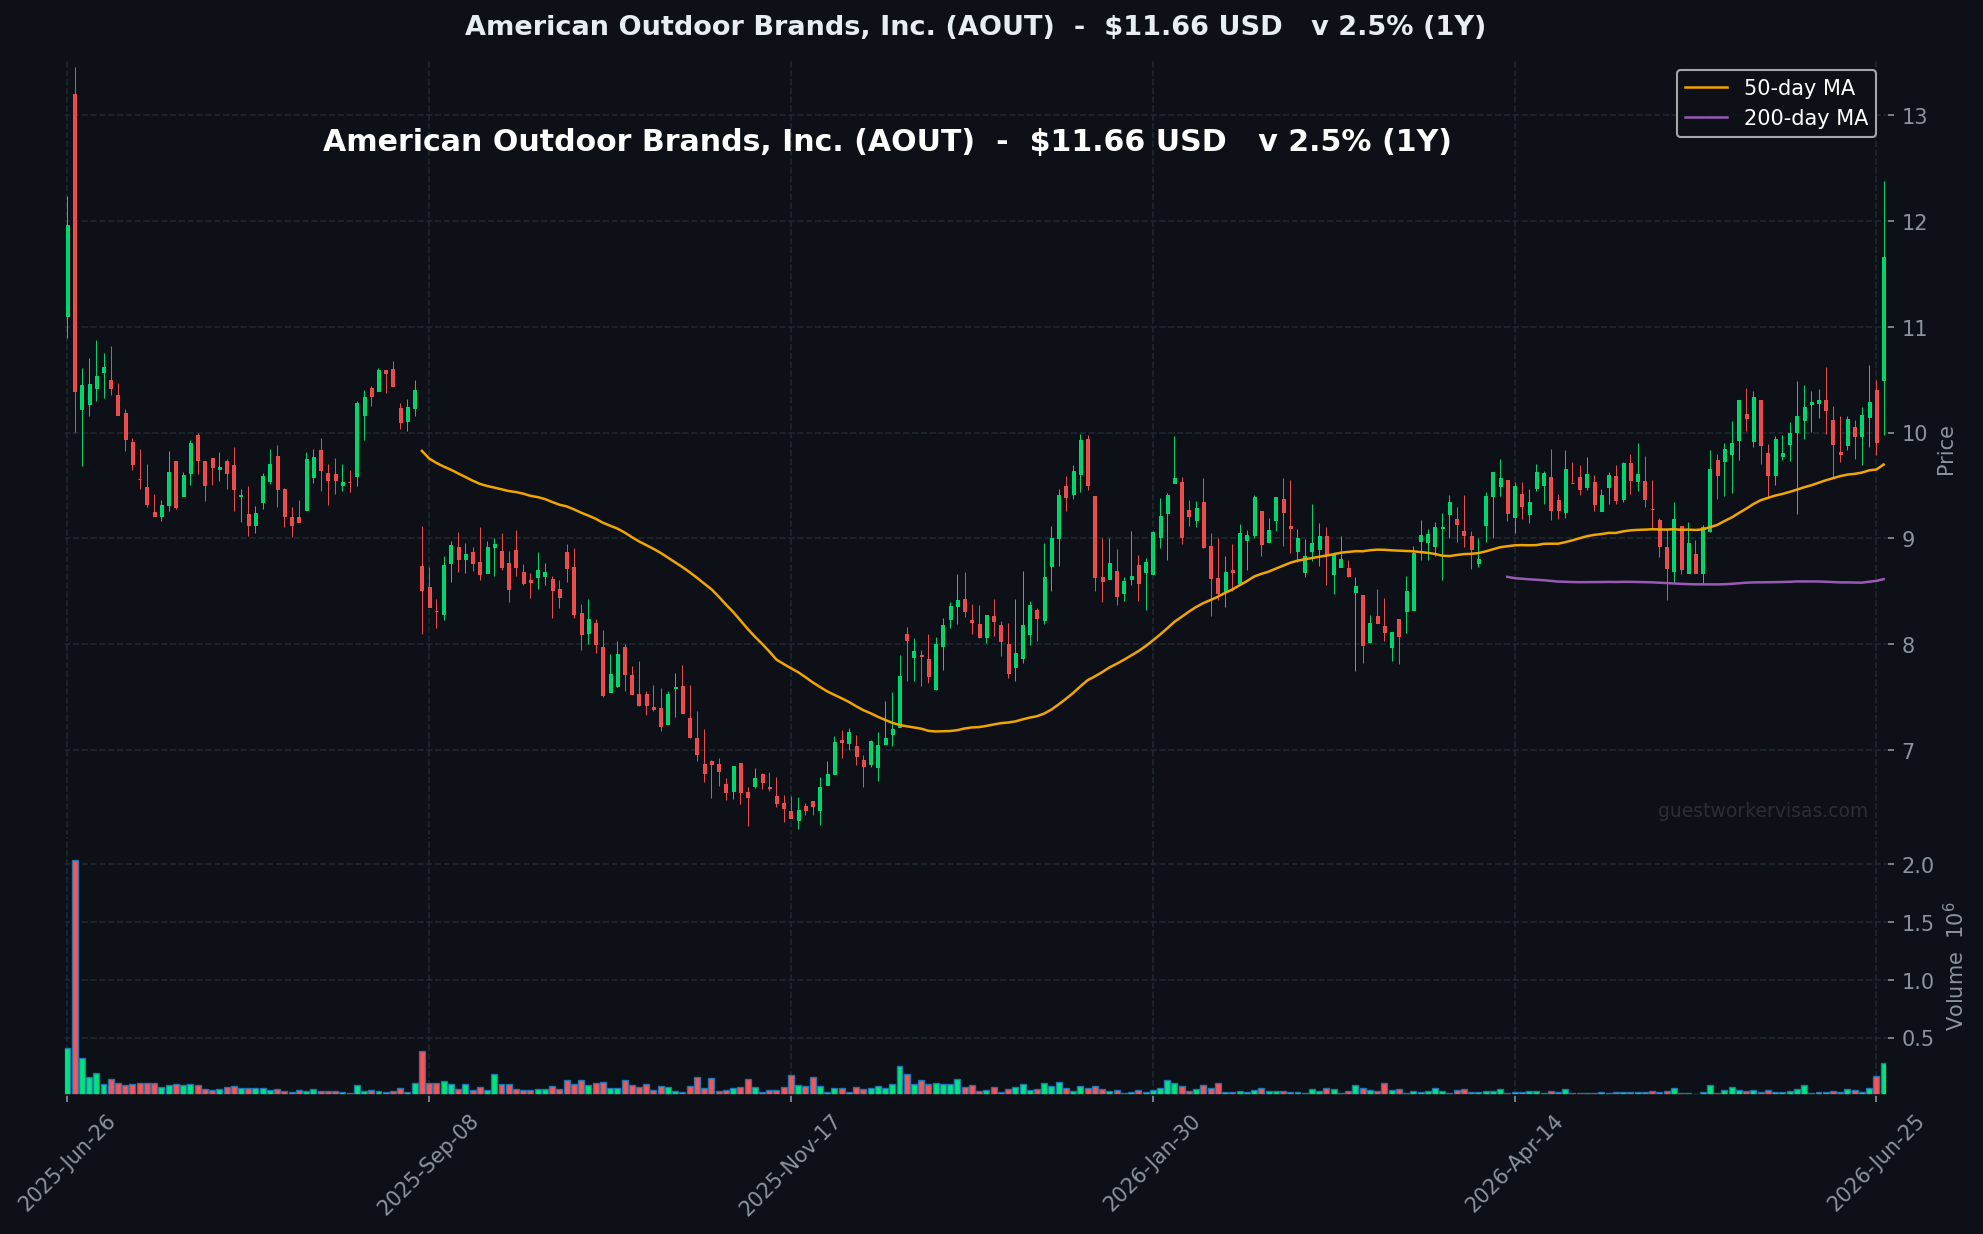
Read the full American Outdoor Brands, Inc. (AOUT) FY2026 Annual Report -> H-1B filings, executive compensation, geographic revenue, workforce data, and shareholder analysis
Read the full VTIX FY2026 Annual Report
Read the full Virtuix Holdings Inc. (VTIX) FY2026 Annual Report -> H-1B filings, executive compensation, geographic revenue, workforce data, and shareholder analysis
Read the full MFBI FY2026 Annual Report
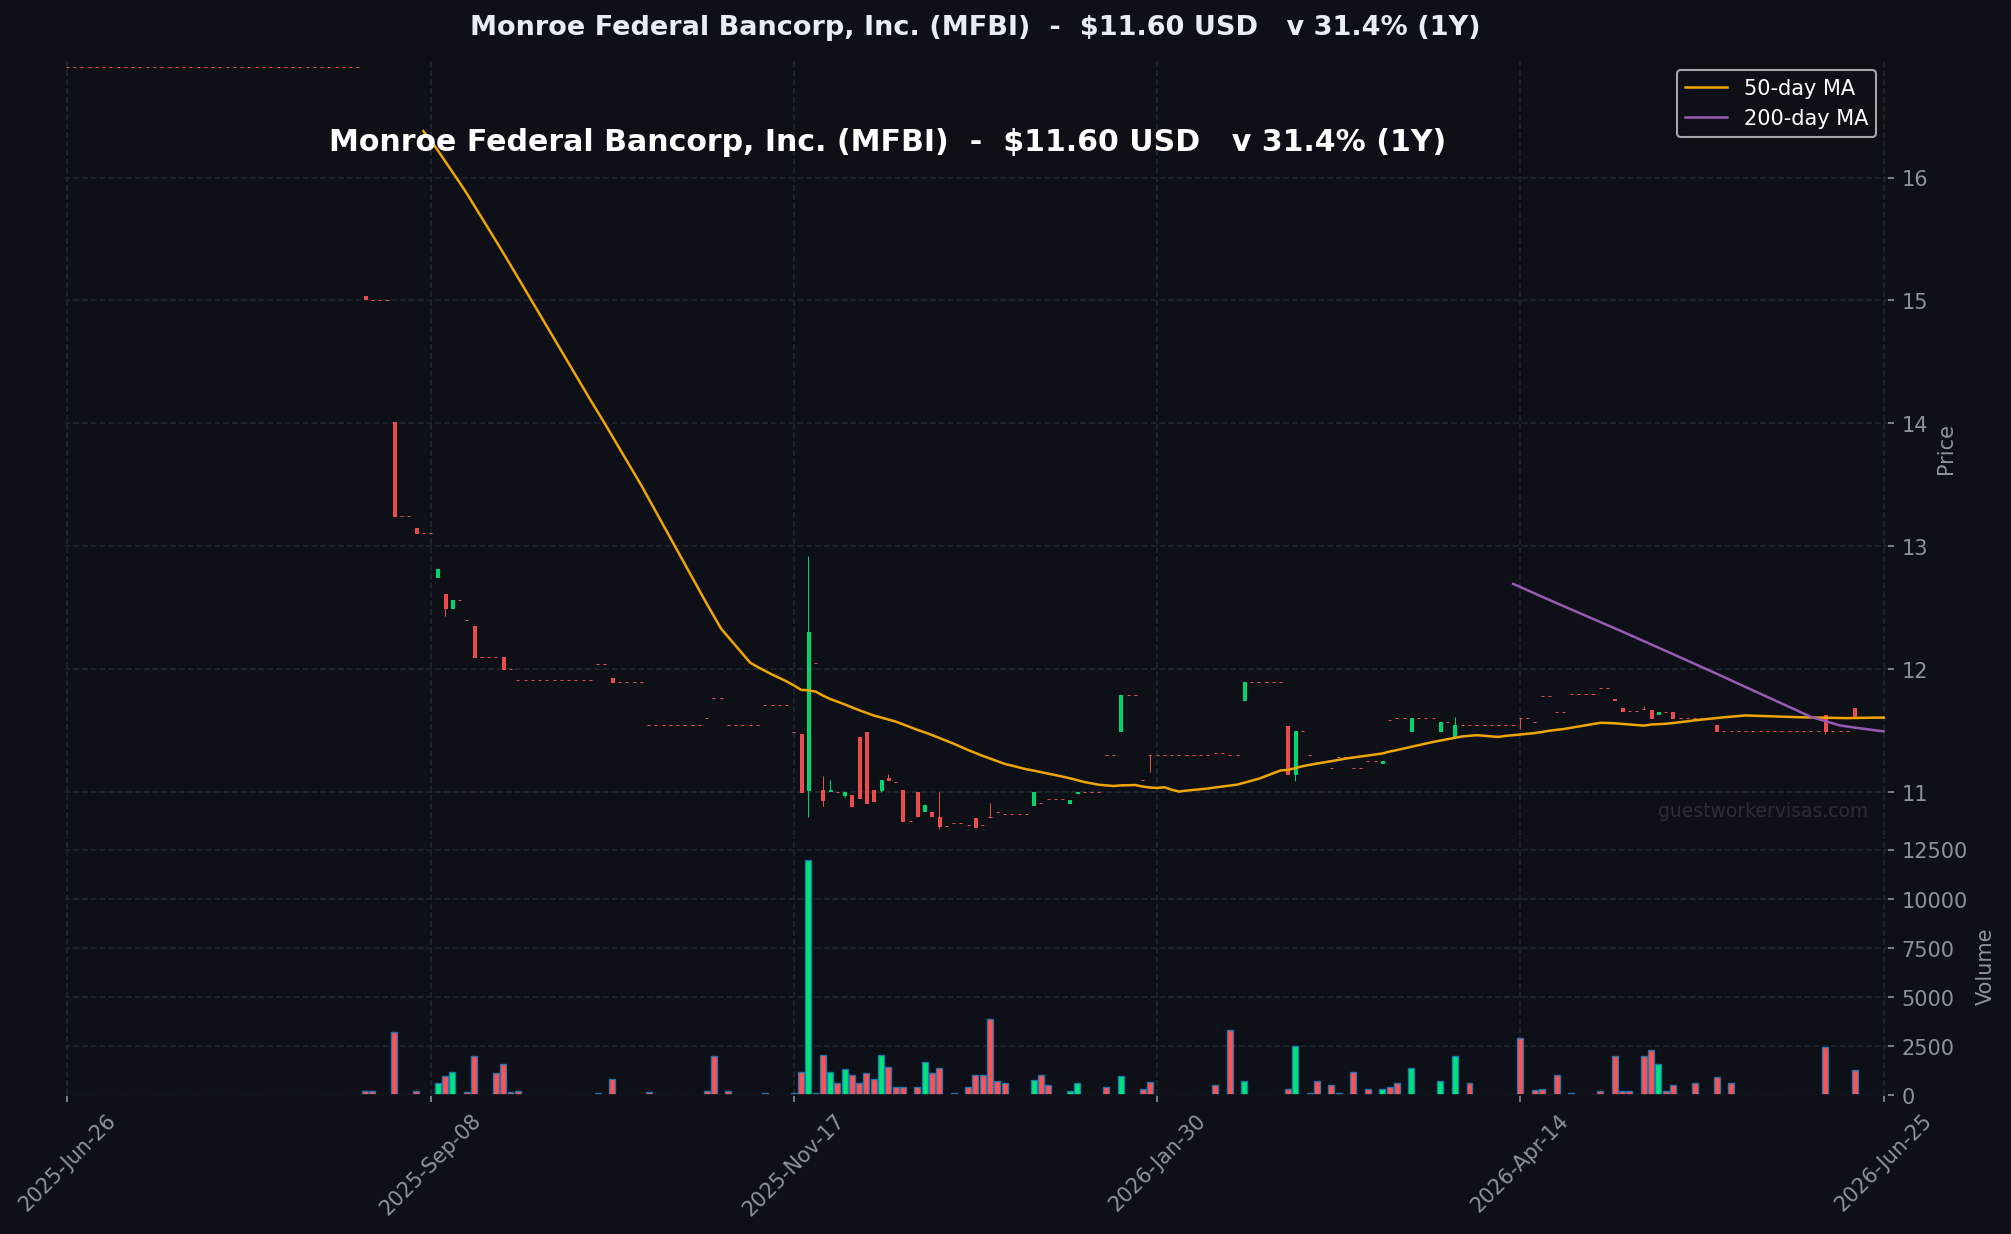
Read the full Monroe Federal Bancorp, Inc. (MFBI) FY2026 Annual Report -> H-1B filings, executive compensation, geographic revenue, workforce data, and shareholder analysis
Read the full IMAQ FY2026 Annual Report
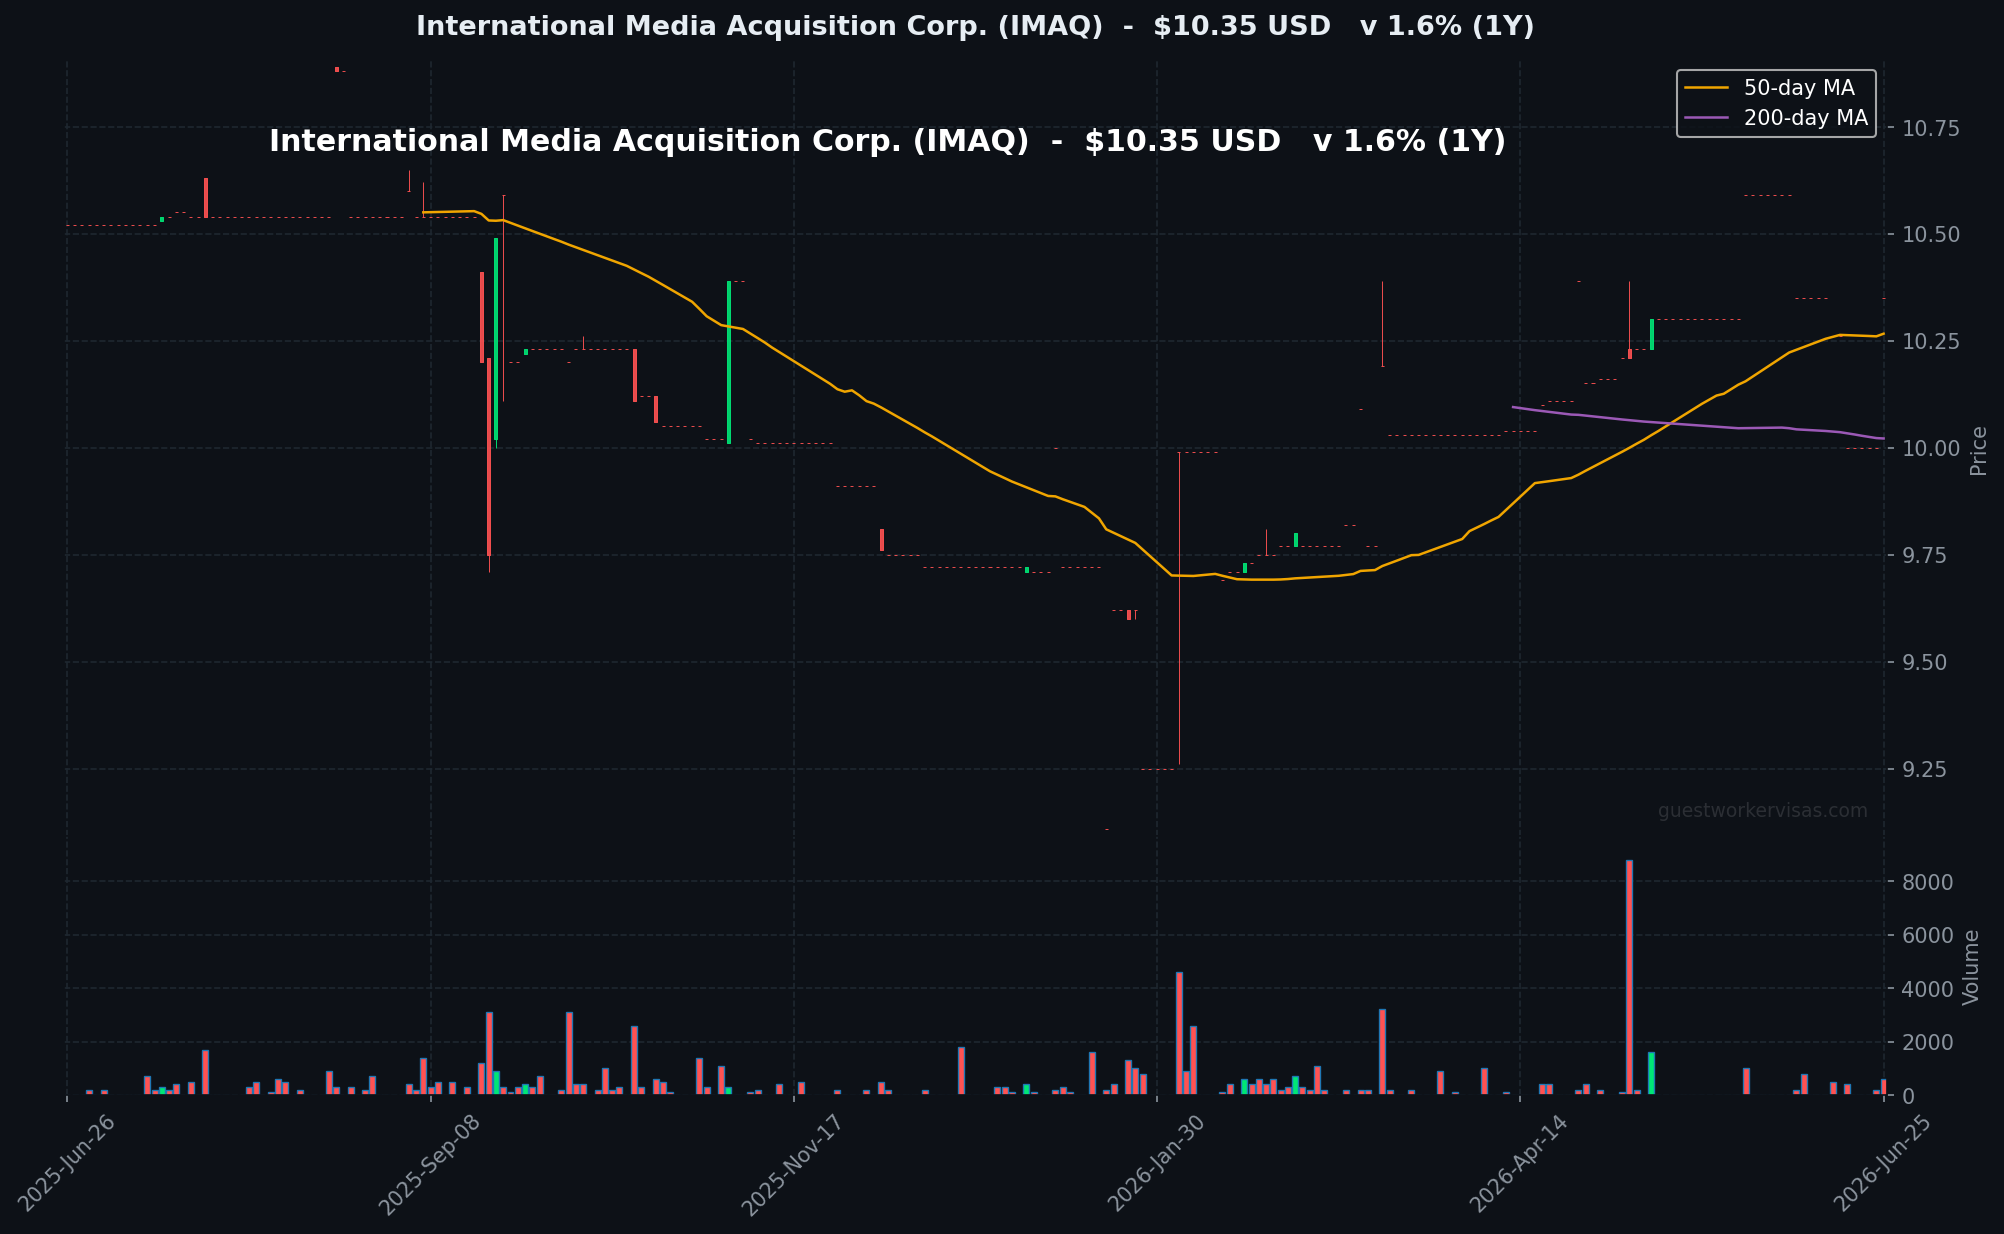
Read the full International Media Acquisition Corp. (IMAQ) FY2026 Annual Report -> H-1B filings, executive compensation, geographic revenue, workforce data, and shareholder analysis
Read the full CGEH FY2026 Annual Report
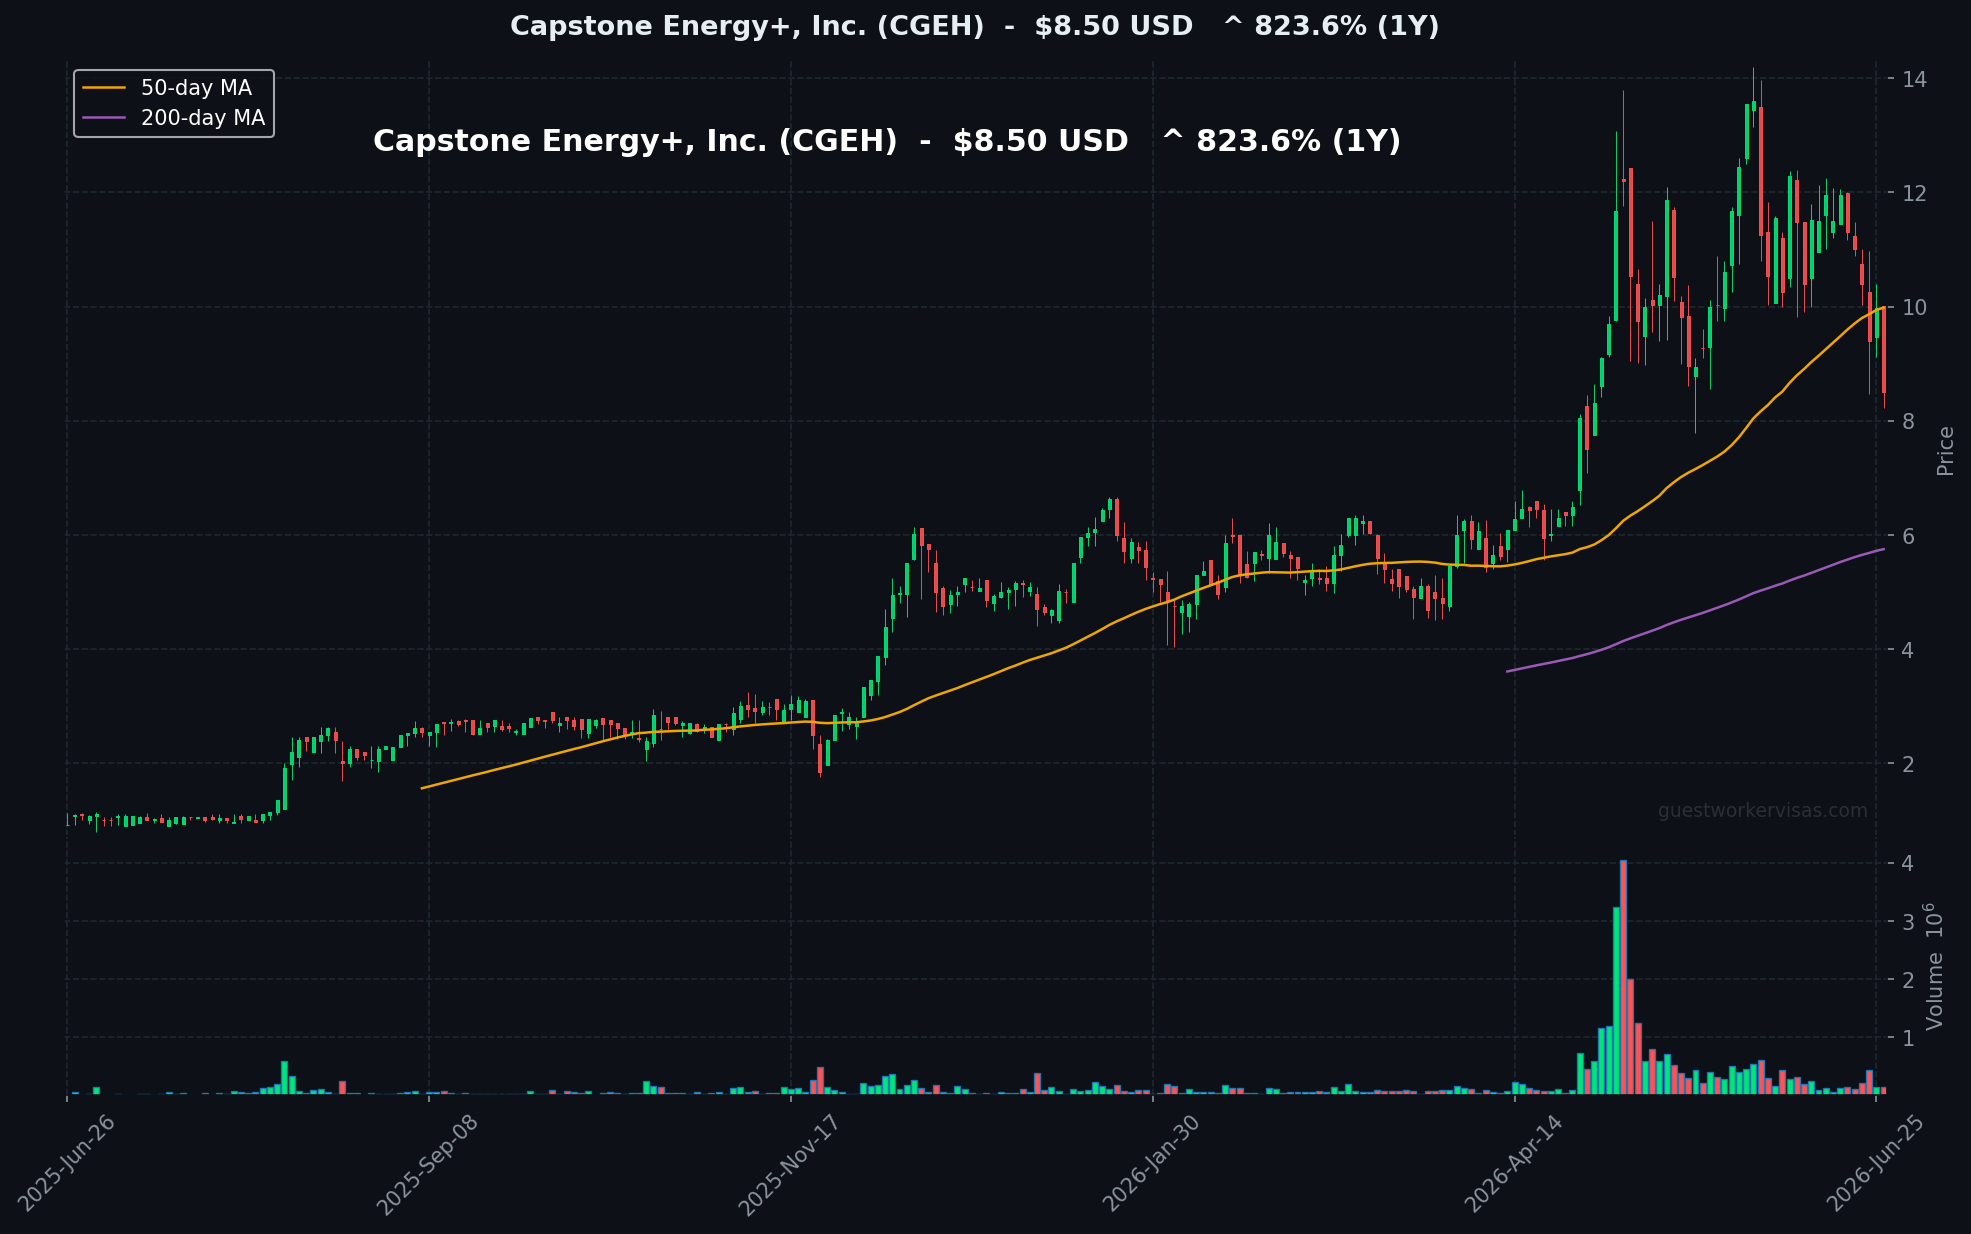
Read the full Capstone Energy Plus, Inc. (CGEH) FY2026 Annual Report -> H-1B filings, executive compensation, geographic revenue, workforce data, and shareholder analysis